
Labelling and testing of foods designated as suitable for diabetic and low calorie diets
Jakov Cordina, Claire Shoemake, Lilian M. Azzopardi
Abstract
The aim of this project was to assess whether consumers, especially those following a diabetic or low calorie diet, would benefit from newly designed food labels denoting glycaemic load and whether these labels would help them make a faster food selection.
Introduction
Over 30,000 patients in Malta have been diagnosed with diabetes, with statistics indicating that there are thousands of other undiagnosed patients who are still not aware that they are suffering from this condition.1 The first line treatment for such patients includes regular exercise and dietary changes, which calls for a moderate consumption of carbohydrates and proteins, whilst increasing the consumption of low sugar-containing fruit, vegetables and fibre, and decreasing the intake of oils and fats.2 The World Health Organization (WHO), whilst advocating dietary changes in diabetes, does not provide guidelines by which patients can be helped to distinguish what food is right for them. Indeed in 19873 , the WHO and the FAO (Food and Agriculture Organization of the United Nations), agreed that foods require better labeling to guide diabetic patients, but adjourned the meeting, noting that due to the advancements being made at the time, a decision on the matter should be taken at a later date. This has, to date, never been re-discussed.
This study aimed to increase the patients’ knowledge regarding how foods affect blood glucose levels (BGL) and empower these patients to make optimal decisions about which foods could help maintain their BGL as stable as possible, thus consequently improving treatment outcomes.
Methods
The study focused on the production of new glycaemic load (GL)- based labels, and on the evaluation of their efficacy in imparting the necessary information to people hailing from all educational backgrounds, using prevalidated standardized questionnaires. Face and content validation of the questionnaire was conducted with a pilot group consisting of six pharmacists, a doctor, two diabetic patients and a house-wife. Most of the suggested changes related to the wording of the actual questionnaire.
The questionnaire was compiled by customers visiting four main supermarkets in Naxxar, Sliema, Zabbar and Gudja over a period of one month. The data collected was subsequently evaluated and analysed using gender, education and dietary habits as baselines.
The labels were produced following the guidelines issued by the UK Coronary Prevention Group whose study showed that graphical representations were found to be better interpreted, on the basis of attractiveness and simplicity.4
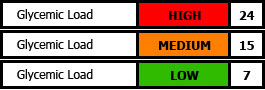
Figure 1: Glycaemic load label section, developed in this study that can be added to any standard food label
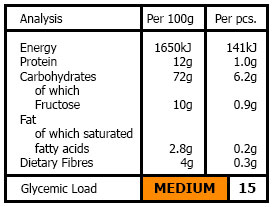
Figure 2: A mock-up of how the new GL section, developed in this study, could be integrated into a generic food product label
A traffic light colour combination was chosen to denote danger, alertness and safety using Red, Orange and Green respectively to represent High, Medium and Low GL brackets – ensuring readability by patients, who in most cases were already accustomed to the meaning of these 3 colours (Figure 1). Figure 2 shows how a GL label, developed in this study, would look like.
A questionnaire was formulated in order to establish demographics of respondents, whether or not they were diabetic or were following a low calorie diet (to establish whether the respondents understood the relationship between GL and absorbance of sugars) and to identify whether or not the new labels prepared in this study would help patients make a faster selection of food products at the point of purchase. Before working through the questionnaire with the respondent, a verbal explanation of how GL could help a patient understand the blood sugar level (BSL) and the absorption of sugars in the body was given. These results were analyzed using frequency studies owing to the fact that these were considered to be more pertinent to the types of questions asked.
RESULTS
In total, 102 respondents participated in the study, out of which 65 were female and 37 were male. The average age of the respondents was 31.8 years (ranging between 18 and 80 years).
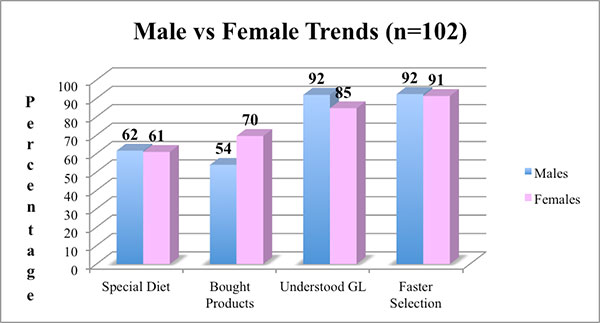
Figure 3: Male vs Female trends
Figure 3 illustrates the difference in responses between sexes. Sixty-two percent (62%) vs 61% of male and female respondents respectively, stated that they were following a diabetic or low calorie diet. Seventy percent (70%) of female respondents buy products for these diets, compared with 54% of males. Ninety-one percent (91%) vs 92% of females and males respectively, thought that learning what GL represents and what GL a specific product has, would aid them make a faster selection of foods for these diets.
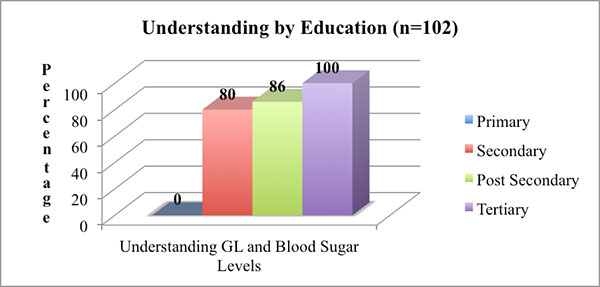
Figure 4: Understanding by education level
In figure 4, the relationship between educational level and the respondents’ understanding of what GL represents is illustrated. None of the respondents who had a primary level of education understood what GL meant and how this affected BSL. Eighty Percent (80%), 86% and 100% of secondary, post-secondary and tertiary education levels respectively understood what the term GL really meant.
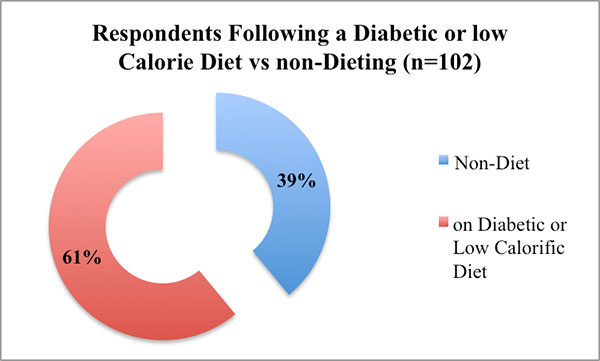
Figure 5: Total Respondents following a diabetic or low calorific diet vs those not following a diabetic or low calorific diet.
Out of all the respondents, 61% stated that they were following a diabetic or low calorie diet (Figure 5). Ninety-five percent (95%) of these respondents answered that the new labels helped them make a faster selection, while only 5% said that this does not affect the speed of the selection process (Figure 6).
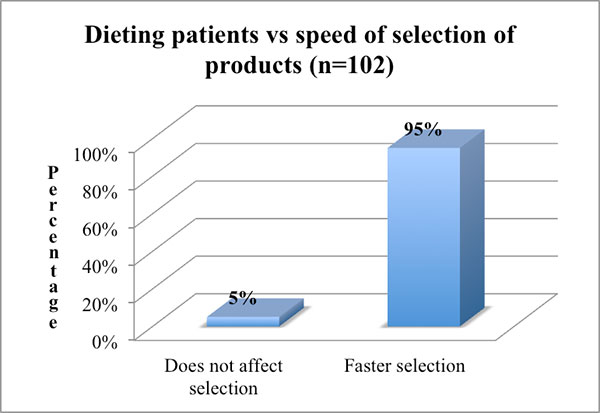
Figure 6: Percentage of patients who are following a specific diet, stating whether the mock-ups affected the speed in selecting which foods to buy
Figure 7 shows that although a higher percentage (14%) of respondents who do not follow a diabetic or low calorie diet were not affected by the new labels, a high percentage (86%) noted that these would enable them to select their food faster.
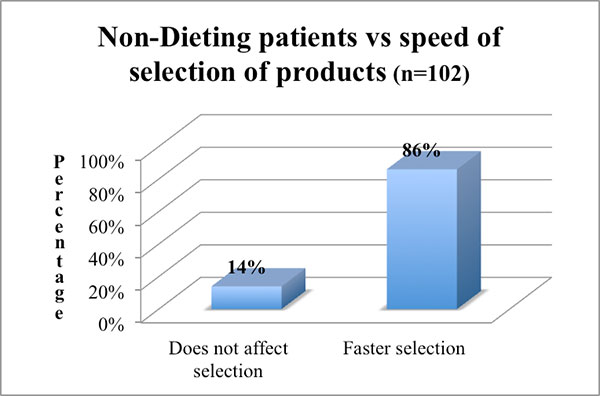
Figure 8: Rating of the GL section on the food label
The overall visual rating of the labels, as well as the ease with which respondents were able to identify the information given by the GL section (new labels) were found to be either good (36%) or very good (64%) (Figure 8)
DISCUSSION
While an equal amount of men (62%) and women (61%) were following a diabetic or low calorie diet, only 54% of males, compared to 70% of females interviewed, actually bought products for these diets – suggesting that women are more likely to be the food buyers in the household. Ninety-two percent (92%) of the men vs 85% of the women interviewed stated that they understood the meaning of GL and how this can be used to indicate how the food affects BSLs. Both men and women (92% of men and 91% of women) confirmed that the new labels would help them make a faster selection of food, should these be included on packages.
The findings of this study have shown that respondents coming from a secondary (80%), post-secondary (86%) or tertiary (100%) educational background, understood the relationship between GL and BSLs. Further education campaigns on the GL and BSL explanation should be undertaken so as to make this easily understood by respondents coming from a primary (0%) background.
Sixty-one percent (61%) of the total respondents claimed to be following a diabetic or low calorie diet, which suggests that a high number of Maltese people are actively following these diets – an indication of the high demand for low GL foods in the community. The implication is that there would be an increased awareness among this population cohort of the importance of reading the labels of the foods that they purchase, which could explain why a higher percentage of the participants claimed that the designed labels would help them make a faster food selection. While being a significant conclusion, this should not be taken to mean that the designed labels appeal exclusively to dieters and diabetics, as evidenced by the fact that all respondents, irrespective of their diet or diabetic status rated the labels as good (36%) or very good (64%).
The GL was selected as being the best value to work for the new labels. The other option of the Glycaemic Index (GI) was discarded owing to the fact the latter does not take into consideration the amount of carbohydrates (CHO) per serving; the GL is the GI multiplied by the CHO amount per serving of the food.5-7
Patient education remains a priority, in that the consumption of a large amount of low GI foods should still be avoided. However, empowering patients to distinguish between food types definitely constitutes a step in the right direction.
REFERENCES
- Maltese Diabetes Association. Available at: www.diabetesmalta.org/index.html
- Government of Malta. Food and Diabetes. Available at: https://ehealth.gov.mt/HealthPortal/health_institutions/hospital_services/mater_dei_hospital/diabetes/food_diabetes.aspx
- Codex Alimentarius Commission. Fifteenth Session; Available at: www.codexalimentarius.org/input/download/report/243/al87_26e.pdf
- Black A, Rayner M. Just Read the Label: Understanding nutrition information in numeric verbal and graphic communication. 1992. London: HMSO.
- University of Sydney. The Glycemic Index. Home of the Glycemic index. Available at: www.glycemicindex.com/
- Paula J. Wart. Glycemic Load Explained. 2003. Available at: www.drdekel.com/content/glycemic-load-and-glycemic-index
- Brand-Miller J, Holt S, Pawlak D, McMillan J. Glycemic index and Obesity. Available at: ajcn.nutrition.org/content/76/1/281S.full.pdf+html

