
Imaging Diffuse Liver Disease – Part I
by Pierre Vassallo
MD PhD FACA Artz fur Radiologie
Consultant Radiologist
Diffuse parenchymal hepatic diseases usually represent a failure in a hepatic metabolic pathway and can be categorized as storage, vascular, and inflammatory diseases.
This article discusses the role of computed tomography (CT), in the evaluation of diffuse liver disease. The prominent role of CT is primarily defined by its capability for excellent morphologic visualization. CT evaluation of the liver always includes non-contrast-enhanced and contrast-enhanced scans; iodinated contrast material injected as a bolus via an intravenous route helps demonstrate normal and abnormal vascular anatomy and tissue perfusion of internal organs at CT.
The physiologic attenuation of liver parenchyma at nonenhanced CT varies between individuals between 55 and 65 HU. Usually, the normal liver parenchyma appears homogeneous at CT, and its attenuation exceeds that of the spleen by about 10 HU. The relatively large range variation in hepatic attenuation is due to the varying content of fat and glycogen; increased diffuse deposition of fat leads to a decrease in attenuation (Figure 1), whereas increased glycogen is reflected as increased attenuation. Storage diseases with iron or copper as deposited metabolites also lead to increased attenuation of the hepatic parenchyma (Figure 2).
Besides quantification of segmental or homogeneous liver attenuation, further valid indications for nonenhanced hepatic CT include, the search for calcifications in clinical scenarios such as calcified metastases of mucinous adenocarcinoma or postinflammatory calcifications in cases of alveolar echinococcosis. Furthermore, unenhanced CT can help detect intrahepatic CT–opaque bile duct calculi. Subcapsular or parenchymal hemorrhage can also be identified in cases of trauma. Visualization of the distribution pattern of Lipiodol, an iodised oil used for intraarterial embolization of liver tumors is another indication for nonenhanced hepatic CT.
Blood circulation in the liver is based on two major components: the hepatic artery and portal vein. Because of this dual-source hepatic blood supply, the patterns of extracellular parenchymal contrast material uptake and the associated changes in tissue attenuation over time follow a complex multicompartmental model. The overall hepatic perfusion cycle can be separated into three idealized perfusion phases: (a) arterial phase, (b) redistribution or portal venous phase, and (c) equilibrium or hepatic venous phase.
Timing of injection of contrast material in CT can be performed in two ways, either arbitrarily assuming normal cardiac output or through aortic bolus tracking. The latter technique uses serial CT scans performed during contrast injection from which serial density measurements are taken in the abdominal aorta to detect peak contrast concentration. Peak aortic enhancement is achieved approximately 10sec following initiation of contrast injection with normal cardiac output.
The early arterial phase of liver enhancement occurs approximately 10 seconds after peak aortic enhancement. In this phase, enhancement of the hepatic artery is observed; usually, no enhanced portal venous blood is evident. In the late arterial phase, at approximately 20 seconds after peak aortic enhancement, the hepatic artery and its branches are best demonstrated; however, a minimal admixture of enhanced portal venous blood may already have occurred. The redistribution or portal venous inflow phase, imaged about 30 seconds after scan initiation, allows visualization of the intrahepatic and extrahepatic portal veins sharply contrasted against still unenhanced hepatic veins. Maximum enhancement of the portal venous vasculature is reached after approximately 40 seconds. The hepatic venous phase can be reached at 60 seconds after peak aortic enhancement, during which simultaneous enhancement of hepatic and portal veins occurs. Because of retained contrast agent, hepatic pathologic conditions such as confluent hepatic fibrosis or cholangiocarcinoma benefit from further delayed hepatic imaging, after the parenchymal contrast agent has mostly been eliminated from physiologic liver parenchyma (Figure 3).
Figure Legends
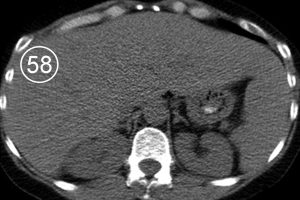
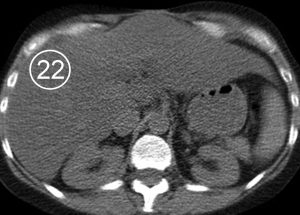
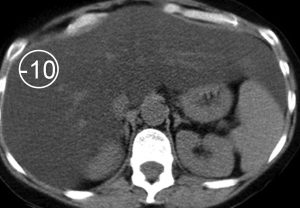
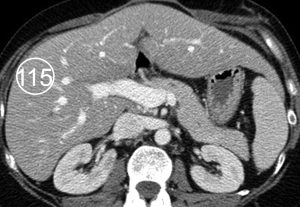
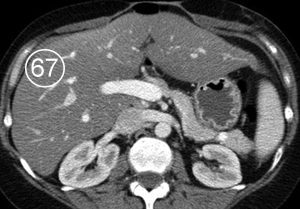
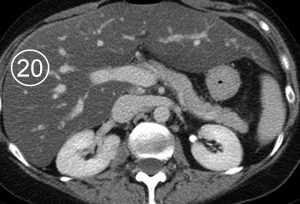
Figure 1. Fatty infiltration of the liver parenchyma in a 46-year-old woman with ovarian cancer who was undergoing chemotherapy. Sequential nonenhanced (a–c) and portal venous perfusion phase contrast material–enhanced (d–f) CT scans obtained at 3-month intervals show a progressive decrease in hepatic attenuation. Circle = region of density measurement, number = attenuation in Hounsfield units.
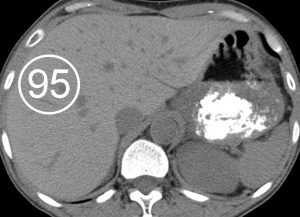
Figure 2. Histologically proved Wilson disease in a 41-year-old man. Nonenhanced CT scan shows increased attenuation of the hepatic parenchyma.
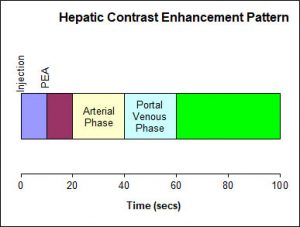
Figure 3. Timing of hepatic enhancement following IV injection of contrast material.